Returns from growth investing have substantially greater than those from value investing over the last decade. Looking back over the last 100 years or so, this isn’t the norm. Will value ever come back, or is growth here to stay? This post will examine the history, along with both sides of the argument.
So What Is a Value or Growth Stock, Exactly?
The investing world likes to categorize stocks in a number of different ways. Geography and size are two of the most popular methods. Another way is value vs. growth. Value stocks tend to be older, more established companies with “cash cow” type businesses. They don’t typically create exciting new technologies that might set the world on fire, but they have stable revenue and profit streams, and often distribute a portion of their earnings back to shareholders through a dividend. Think of companies like GE, Exxon Mobile, or Home Depot.
Growth companies operate a little differently. They typically reinvest 100% of their earnings back into the company to fuel future growth, rather than pay dividends to shareholders. They often have new products, services, or technologies that are spreading around the world like wildfire. Your FANG stocks are great examples of typical growth companies: Facebook, Amazon, Netflix, and Google. All have new technologies, services, or models that are taking the world by storm.
From an investment point of view, the reason you might buy a value stock is completely different than why you might buy a growth stock. In a value investment, you’re purchasing company shares because you think they’re worth more than the current market price. “Undervalued” is a common term you’ll hear in a value investment strategy. Metrics you might track to make this determination are price to earnings ratio, price to book ratio, or dividend yield.
Current share prices don’t matter as much in growth investments. In a growth investment you’re not buying a stock because you think it’s cheap; you’re buying it because you think the company will continue growing at an above average rate. Look at companies like Amazon. They’re terribly expensive on a valuation basis, but that doesn’t deter investors in the least. The company is growing so rapidly that the expensive valuation simply doesn’t matter to those buying shares. Metrics you might track here are earnings growth rate, EBITDA (earnings before interest, taxes, depreciation & amortization), or momentum.
Which Strategy Tends to Perform Better?
So is there a superior strategy? This is the subject of a lot of debate in the investment community as of late. Over long stretches of time, say 30 years or longer, there’s little doubt that value investing has performed better than growth investing historically. There are a few time intervals where growth has done better, but they’re few and far between.
Currently we’re in a cycle where growth investing has done far better than value. The chart below shows us the difference in total returns between the Russell 1000 Growth Index (blue) and the Russell 1000 Value Index (green) over the last ten years. Dividends and other distributions are included.

**Source: Kwanti
Notice how there wasn’t much difference in performance over the first five years here. But since 2015 or growth has really taken off.
Now let’s look at the chart after stretching the period out 10 years.

**Source: Kwanti
Here we’re looking at performance returns between 2000 and 2019. If you recall, 2000 was directly before the dot com bubble. Unprofitable tech stocks were being taken public at huge valuations, and in 2001 the house of cards collapsed. The tech sector suffered greatly (comprised of predominantly ALL growth stocks), while reasonably priced value shares didn’t lose as much ground.
I should note that there is a lot of selection bias here. Obviously, growth investing strategies will not perform as well when the period we examine begins directly before a crash in technology and growth stocks. Nevertheless, value tends to do better over longer stretches of time.
Going all the way back to 1927, value has outperformed growth in 61% of the 12 month periods ending on 12/31/2018 (with growth outperforming 39% of the time). But when you stretch that out over longer periods of time, value starts to pull away more dramatically. Over 5 year intervals value outperforms growth 75% of the time, and over 10 year periods 84% of the time.
You’ll notice that I source a lot of my data & charts from Dimensional Fund Advisors. Dimensional has long been a proponent of factor based investing, in a way that typically favors value over growth. The reasoning behind this preference is simple: the data supports it.
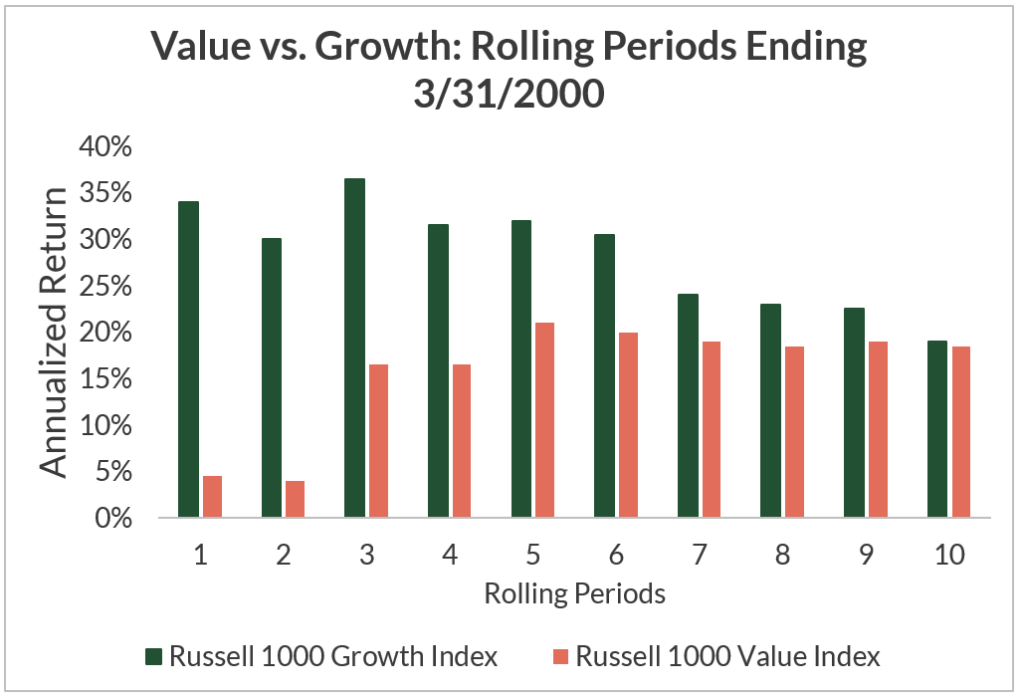
Look what happens when we examine annualized returns of growth versus value over different time periods ending on 3/31/2000. Remember what the world was like then? This was the hay day of the dot com bubble, and growth was crushing value.
Look at the one year period between 3/31/99 and 3/31/00. Value didn’t have a bad year, appreciating 4-5%. But growth rose nearly 35%. And between 3/31/1995 and 3/31/00 growth appreciated an average of 32% per year.
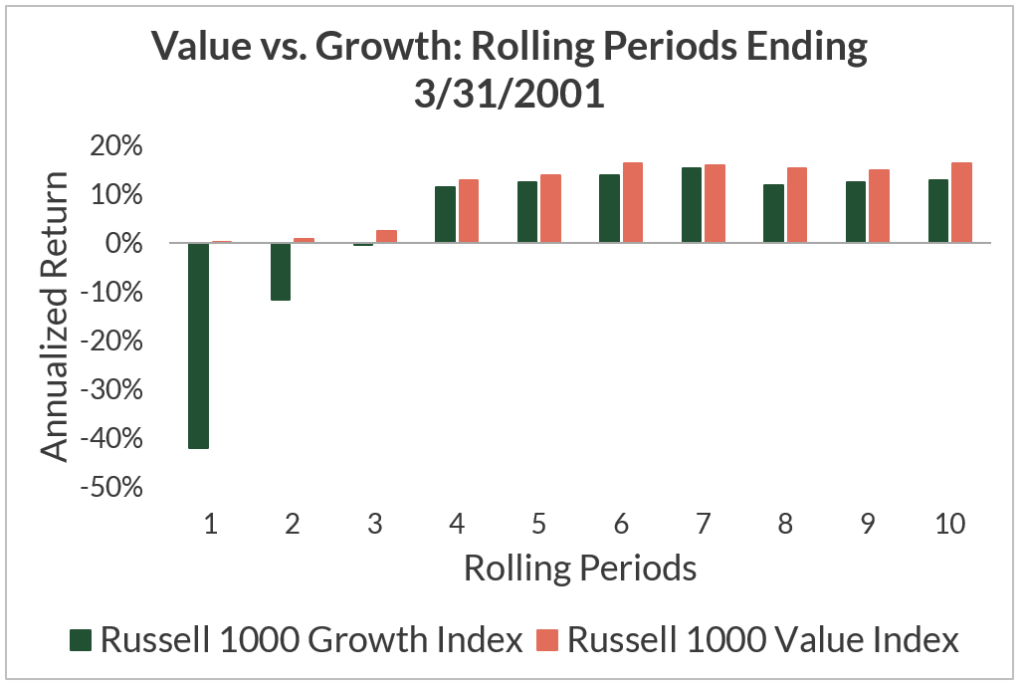
But look at the results after we fast forward 12 months. The dot com bubble crashes, along with tech and growth stocks. Value shares barely move. And looking at the ten year period between 3/31/1991 and 3/31/2001, value’s performance slides back toward its long run norm.
What does this mean? When value catches up, it does so quickly. The period above is the most extreme example (during a tech bubble crash), but you could argue that’s the same environment we’re in now.
What Should We Expect Going Forward?
The long term trend is clearly in favor of value. Growth advocates have a strong argument as well, though. The internet has sparked a technological revolution over the last 20+ years, and it’s very possible that future market returns could be driven by tech and growth sectors as a result.
But I’m not betting on it. I’m not an advocate for abandoning growth stocks entirely, but I do have a preference for lower risk, stable companies with strong free cash flow. I’ll finish this post with two charts. The first shows us the difference between value and growth investing returns since 1928. The blue columns above the horizontal axis represent years where value outperforms. The red columns below the horizontal axis show those in which growth outperforms.

Source: Dimensional Fund Advisors
Look at the magnitude of the years where value outperforms. Now compare them (in frequency and magnitude) to those where growth does better. Value does better far more frequently, and in far larger amounts.
Now let’s review individual rolling decades (1990 – 2000, 1991 – 2001, etc.) rather than 12 month periods. Let’s also order each of these rolling periods from best to worst decades for value:

Source: Dimensional Fund Advisors
It’s difficult to read, but the arrow is pointing to the most recent 10 year period (which ends in 2017 – the chart is a year old). Not only are there only a few decades where growth outperforms at all….we’re in the fifth worst decade for value ever!
While it’s true that we’re in the middle of a technological renaissance, I just don’t see the long term trending being bucked on its head so drastically. It may be a while longer before it happens, but I’d expect value shares to come roaring back at some point.


