Picture what you were doing on January 1st of 2019. Maybe you were getting an early start on your fitness goals for the year. Maybe you were up early, ready to take in some New Year’s day football. Maybe you were in bed all day nursing a hangover.
If I were to ask you what you thought the stock market would do in 2019, what would you have said?
Would you have guessed that 2019 was the year that the 10-year bull market finally came to and end? Would you have said you had no idea?
What I’m guessing you wouldn’t have said was that the S&P 500 would be up 30% on the year, tossing market bears aside like leftover confetti from the night before. At least I wouldn’t have.
Yet here we are, about one year later, and that’s exactly what happened. And not only did the S&P climb 30% on the year, it did so in extremely steady fashion. This was true in the fourth quarter of 2019, just as it was in the first three.
Could this be the year that the bull market wanes? Read on for more details and background.

**Source: Dimensional Fund Advisors

**Source: Dimensional Fund Advisors
U.S. Equities
Whereas the steady growth of U.S. equity values continued in Q4, I’ve been paying more attention to two specific factor premiums: value vs. growth and small cap vs. large cap. If you look at the period returns section below, you’ll notice that over nearly every time interval, large cap US stocks have outperformed small caps, and growth has outperformed value.
This is not the long term trend. When spread over several business cycles, small cap and value shares tend to do a little better than large cap and growth. While a rising tide lifts all boats, I am expecting small caps and value shares to catch up quickly during the next market cycle. These factor premiums have persisted over and over again, across different time frames, governmental regimes, and economic history. While shares of companies like Amazon, Google, Netflix, and such have led much of the performance of the US markets of late, I don’t expect these premiums to go away.
Looking at the data and trends, while the U.S. economy continued chugging along in 2019, it was bogged down by slowing global growth, weaker earnings growth, and continued trade war with China. While the news headlines would tell you that the trade war has been “solved”, the analysis I’m reading is that the agreement between President Trump and President Jingping is hollow lip service. While they’ve agreed not to hike tariffs further, nothing else has really come off the table. The fact that the U.S. has taken China off its list of “currency manipulators” effectively does nothing.
Does this reduce the risk of trade war escalation in 2020? Perhaps. But it’s more likely that the U.S. economy will run into more headwinds this year. So to summarize, don’t expect another 30% out of the S&P 500 this year.

**Source: Dimensional Fund Advisors
International & Emerging Markets Equities
While my description of global economic growth in the section above was somewhat pessimistic, there have been signs of stabilization of late. The World Bank recently published its global growth forecast for 2020. While we enjoyed global economic growth of between 3% and 3.2% in both 2017 and 2018, the World Bank is only expecting 2.5% in 2020. This is higher than their previous forecast, and higher than last year’s 2.4%.
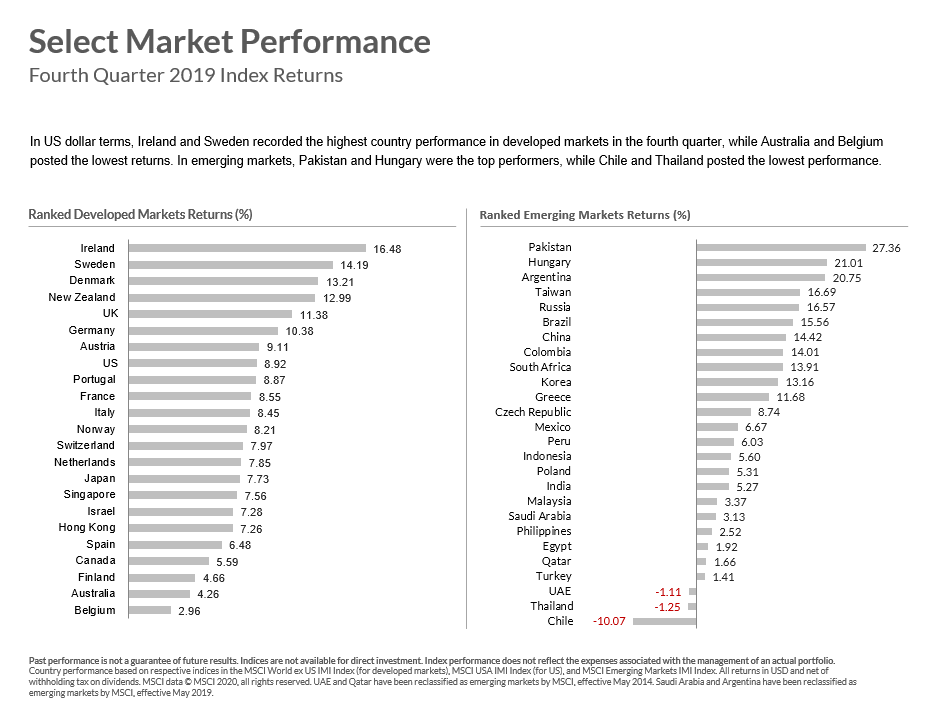
Just as in the U.S., Q4 was a period where small caps did better than large caps, but value trailed growth in developed economies abroad. This was not true in the emerging markets, where large cap and growth both outperformed.

**Source: Dimensional Fund Advisors

**Source: Dimensional Fund Advisors

**Source: Dimensional Fund Advisors
Fixed Income
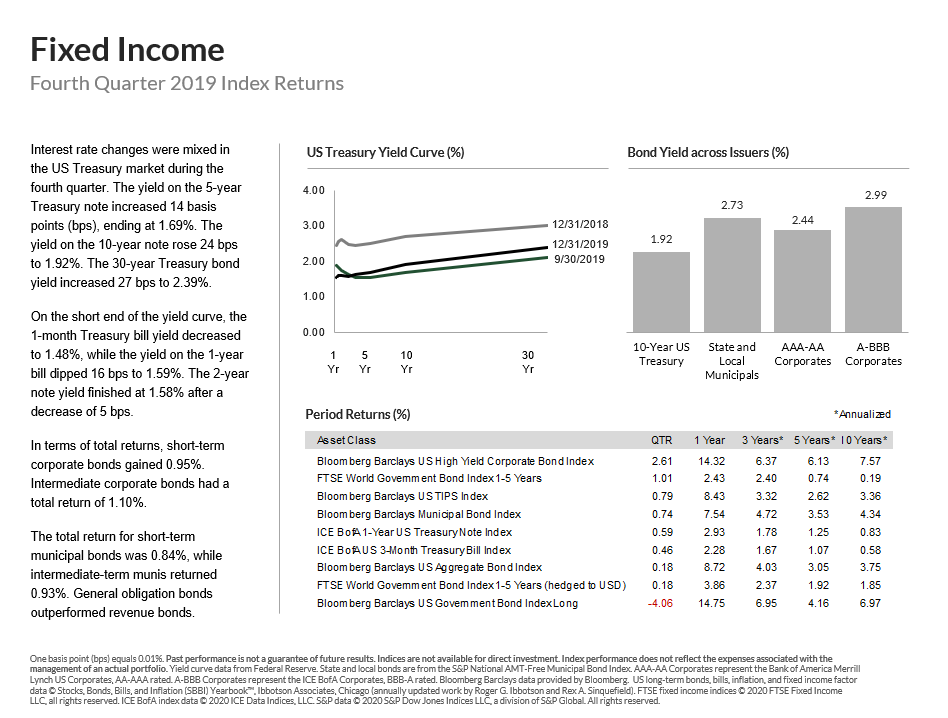
The yield curve remains at low levels (compared to longer dated history), with the 10-year U.S. treasury yield hovering between 1.8% and 1.9%. At this stage in the game, there’s little reason to think interest rates will jump before the election cycle. The Federal Reserve has been transparent (as transparent as it can be, I guess) that it plans to continue it’s current monetary policy for the time being. Inflation is not an issue currently, and the economy is still growing near 2% per year.
I mention the election cycle because all bets are off if the White House changes parties. I can’t imagine that Mike Pence would drastically change course on fiscal policy if President Trump were removed from office. But if a democrat is elected later this year, we could see changes that stoke longer term rates. Alternatively, if inflation creeps back into the picture bond yields would be pushed upward as well.

**Source: Dimensional Fund Advisors
Real Estate Investment Trusts
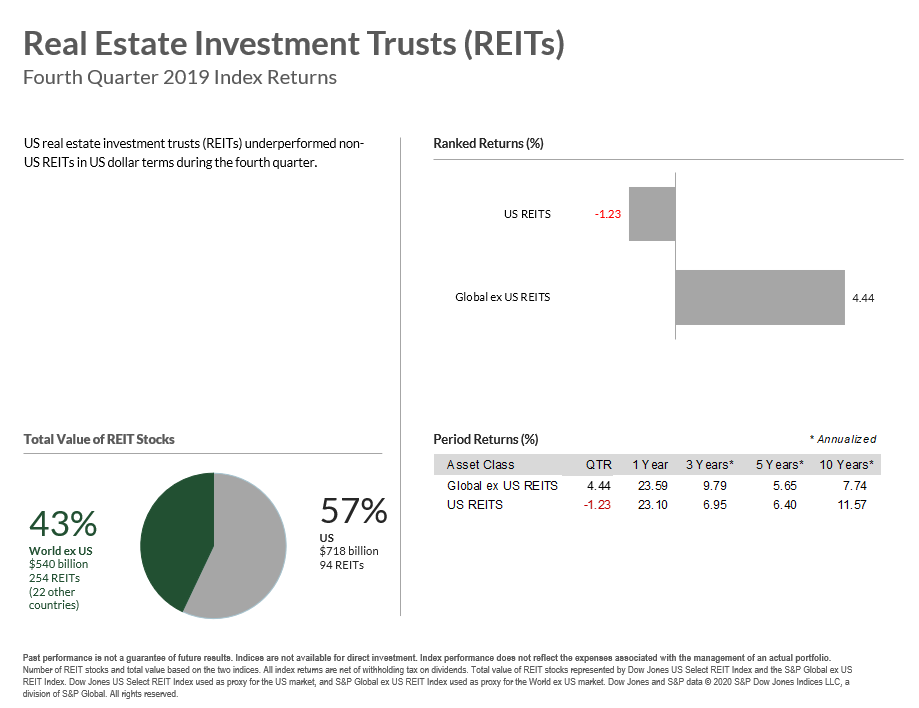
Real estate investment trusts lost ground on the quarter, but finished the year strong, growing 23.1% as an asset class. This is remarkably similar to REITs elsewhere in the world, which grew 23.59%.
Looking at the longer term trend, REITs have benefited from the bull market just as stocks have. Over the last 10 years U.S. based REITs have risen 11.57% on an annualized basis, compared to 15.22% for large cap stocks.
REITs come in all shapes and sizes, but are heavily dependent on the economy. Most REITs that comprise the index shown below hold various commercial real estate buildings, including high rise offices, hospitals, and strip malls. Just like the earnings on stock shares, REITs have a hard time producing earnings when recessions hit. Management has a more difficult time leasing its buildings, and rental income tends to stagnate and even dry up.
The benefit of holding them in your portfolio is that they’re not terribly correlated to stocks. I’ve seen a number of different studies that estimate the long term correlation between REITs and stocks to between 0.20 and 0.25. This is good – the less correlated an asset class is to your core holdings (probably stocks), the bigger the diversification benefit. They’ll lose value during market downturns, but are a worthy asset class in your household portfolio.

**Source: Dimensional Fund Advisors

